
Does your cat have one of these 5 popular personality types?
Many feline families say their pet is “priceless” no matter what.

There is a pricetag on owning a cat — but many feline families say their pet is “priceless” no matter what.

The average American spends $25,304 on their furball during its life, according to a poll of 2,000 cat owners. For two in three, it’s led to the belief that their cats are truly the queens and kings of their home.
Based on an average 15-year lifespan for cats, the costs really stack up — in a cat’s lifetime, $764 alone is spent just replacing or repairing scratched-up furniture.
Per visit, vet appointments were found to cost $111 out of pocket on average — twice to four times as much as the copay from a human doctor visit.
And these costs don’t even include food or toys, which can run up an average $109 per month and $108 per year.
Aside from being royalty, owners found their cats tend to take on one of five major personality types.
Commissioned by Solid Gold and conducted by OnePoll, respondents were encouraged to find the personality types of their cats. Six in 10 said they own little “graffiti artists”, prone to kneading their paws on everything or scratching every surface they can.
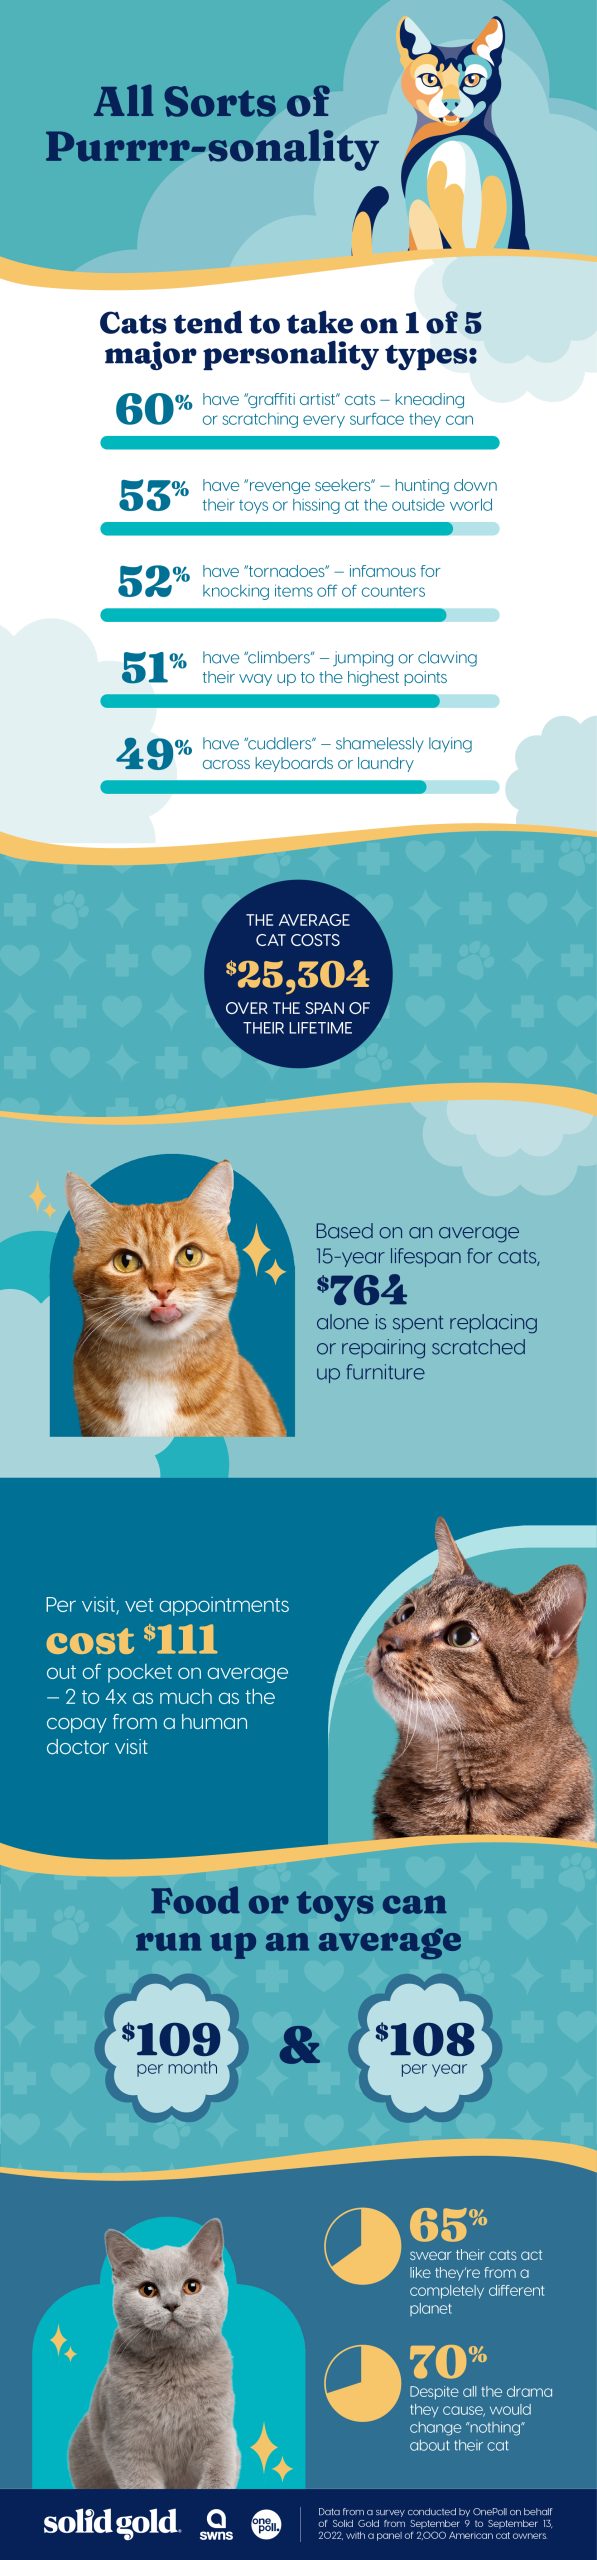
Over half (53%) said their cats were true “revenge seekers” when they hunt down their toys or hiss at the outside world. Nearly as many (52%) own “tornadoes” infamous for knocking items off of counters and causing a mess of mischief wherever they go.
Cat owners also have a near 50/50 shot of ending up with a “climber (51%) clawing their way up to the highest points of the home, or a “cuddler” (49%) who shamelessly lay across keyboards or piles of clean laundry.
The study also found that 65% swear their cats act like they’re from a completely different planet. A good portion of that sentiment comes from the strange things owners have caught their cats in the middle of.
For instance, 73% of “revenge seeker” owners have witnessed their cats doing something completely, unexpectedly wild.
Meanwhile, 76% of “tornadoes” are practically predictable: have been caught red-handed breaking and tearing things around the home — especially where clothing (44%), sofas (42%) or rugs (42%) are concerned.
Nearly four in five “cuddlers” (78%) are seen as complete angels by their owners when they’re not causing any trouble and 71% of “graffiti artists” are anything but angels when the havoc they bring has to be repaired or replaced by distressed owners.
Many shared the wildest behaviors they’ve witnessed from their felines: gifting owners with their “kills” in the form of cat toys and pinecones, begging for bananas or learning to turn door knobs to get into rooms.
“We love our cats because of how unique their personalities can be,” said Steve Ball, CEO at Solid Gold. “No matter what kinds of chaos they bring, there’s no denying the things we would do for our furry friends. At the end of the day, pet parents want to make sure their cats are able to be their unique selves for as long as possible.”
Despite all the drama they cause, 70% of cat owners said there’s “nothing” they would change about their cat.
It seems all the frustration caused can be cured when cats turn cute, which according to those polled, is wherever they’re playing (50%), eating (40%), purring (37%) or sleeping (37%).
More than three in five (63%) said nothing is more exciting to them than mealtime for their cat. At feeding time, cats are most likely to let their humans know they’re ready when they meow (49%), paw (37%) or headbutt (34%).
“Mealtime is a universal ‘stop-destroying-the-home-and-come-eat’ moment for cats,” continued Ball. “It’s so important to make sure your cat is getting the proper holistic nutrition they need in order to get back to doing what they do best.”
TOP 10 THINGS LIKELY TAKEN OVER BY CATS
- Clothing - 39%
- Rugs/carpets - 38%
- My sofa - 37%
- Drinking glasses - 35%
- Chairs - 34%
- Table legs - 31%
- Power cables - 30%
- Drapes - 29%
- Phones - 27%
- Hardwood floors - 24%
Stories and infographics by ‘Talker Research’ are available to download & ready to use. Stories and videos by ‘Talker News’ are managed by SWNS. To license content for editorial or commercial use and to see the full scope of SWNS content, please email [email protected] or submit an inquiry via our contact form.


Touching moment brother and sister reunite after 45 years
"I didn't realize it had been so long."


Meet the 2-year-old chef obsessed with cooking shows
She started cooking when she was 11 months old alongside her mom.


Man running marathon after learning how to walk again
He was in a coma for three weeks after he suffered a fall in October 2020.


Couple find medieval gargoyle imp hiding in their bathroom
The couple took to social media for answers.


Farmer finds ‘unprecedented’ litter of 10 fox cubs
The farmer accidentally dug up their den while working.

 Food & Drink1 week ago
We eat enough grilled cheeses a year to fill 900 Olympic swimming pools

 Broadcast1 week ago
Over 50% of Americans trust Google more than their schooling

 Broadcast1 week ago
Americans eat enough grilled cheeses a year to fill 900 Olympic swimming pools

 Broadcast2 days ago
Over 40% of Americans have no clue what a 401k is

 Broadcast1 week ago
Grocery shopping hungry is costing Americans this much

 Funny1 week ago
Cops confused by crow mimicking police siren
- Money1 week ago
Over 50% of Americans trust Google more than their schooling
- Shopping1 week ago
Grocery shopping hungry costs Americans this much every trip