
Average person believes websites will become obsolete in next 10 years
More than one in four people think they can go a year without using a standard computer browser.

The average person believes websites will become obsolete in the next decade.

A recent survey of 2,000 U.S. adults discovered seven in 10 (70%) believe apps are gradually replacing websites.
With people relying on their phones for absolutely everything, it’s no surprise more than one in four (26%) think they can go a year without using a standard computer browser.
While 69% use their smartphone daily, only 44% report using their desktop or laptop with the same frequency.
Forty-six percent have even done a full day’s work entirely from their smartphone, and 42% have used it to file a tax return.
Conducted by OnePoll on behalf of Cricket Wireless for their Tax Time initiative, the survey also found that if forced to choose between a smartphone and a computer, 59% would opt for their phone.
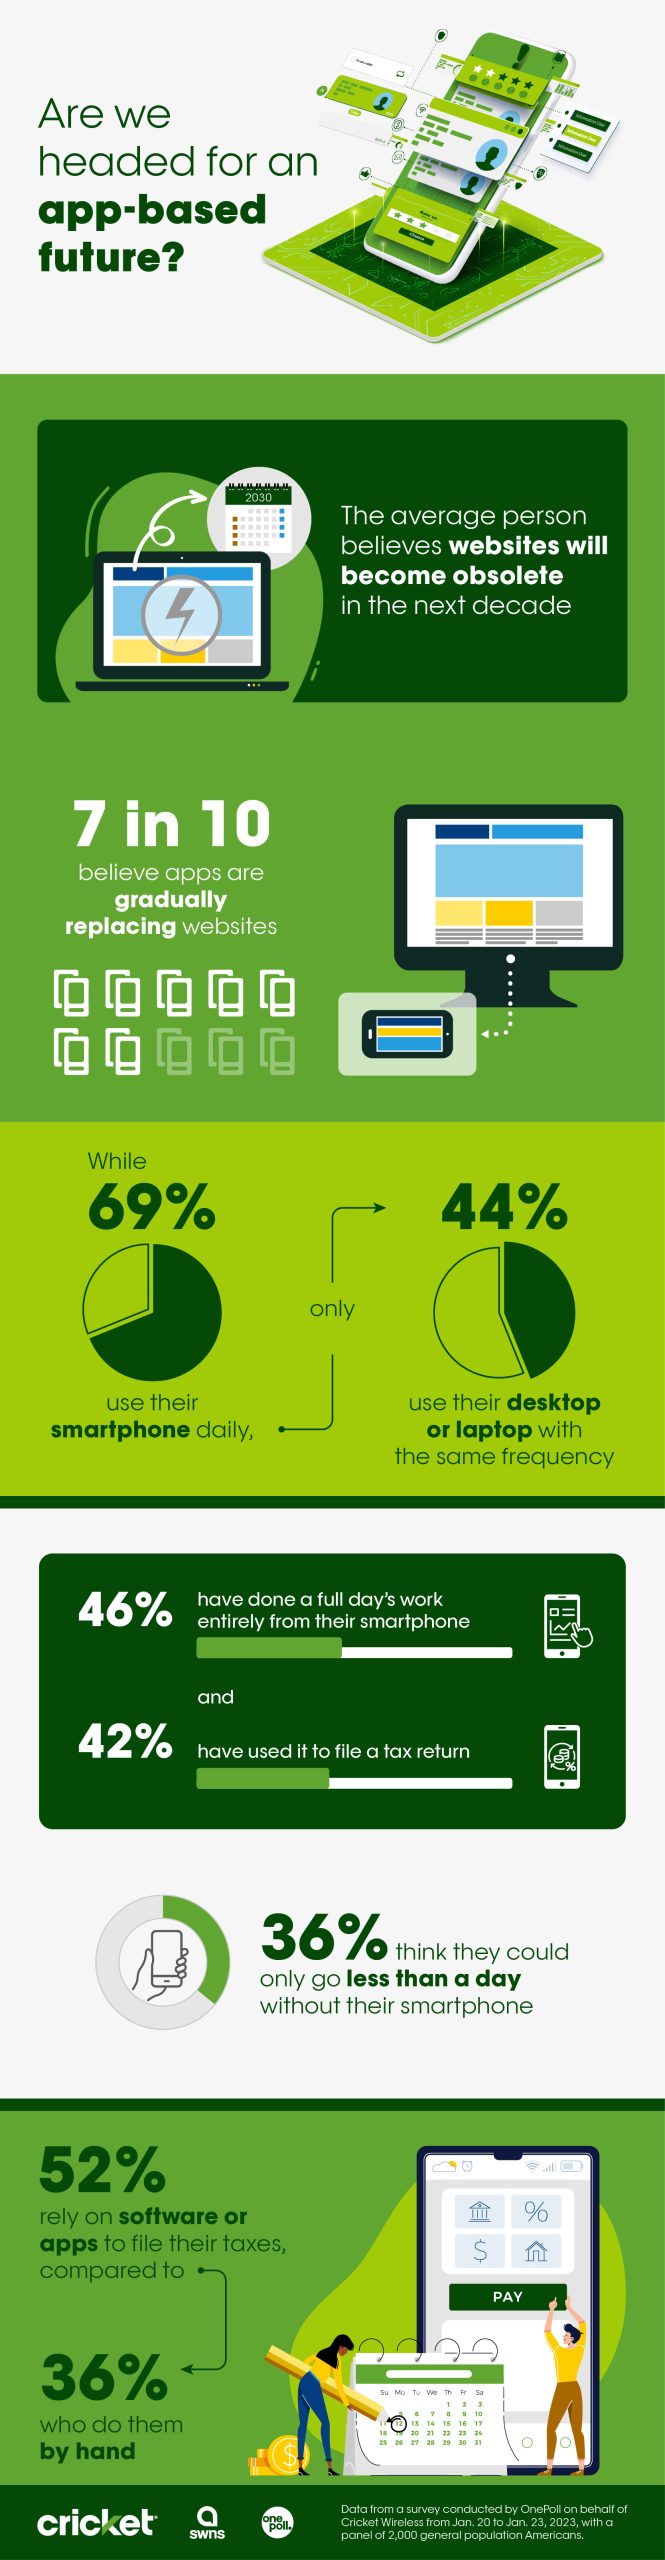
Thirty-six percent think they could only go less than a day without their smartphone. iOS users proved to be rather resilient, with 34% claiming they can survive phoneless for a week compared to 21% of Android users.
While entertainment (67%) and communication (66%) apps rank among the most common, more respondents have a finance app on their smartphone (59%) than those who have news/magazine apps (28%).
“From work to play, our research shows people are embracing the convenience of apps in all areas of life,” said Tony Mokry, Vice President & Chief Marketing Officer for Cricket Wireless. “Apps can also be a great way to try out alternative services before committing.”
More than half of respondents (52%) rely on software or apps to file their taxes, compared to 36% who do them by hand.
Interestingly, only two in five (40%) anticipate getting a tax refund in 2023, with the average person expecting about $2,338.
Those expecting a refund plan to put it toward a mobile wallet (25%), deposit it in a traditional checking or savings account (25%) and add it to an investing app (23%).
“There are many ways to get the most out of your refund, such as by upgrading your phone and wireless provider simultaneously,” Mokry added.
THINGS PEOPLE HAVE DONE ENTIRELY ON THEIR SMARTPHONE:
- Shopping for groceries - 51%
- Taking photos/videos for special events - 51%
- Shopping for clothes/accessories - 47%
- Completing a full day’s work - 46%
- Completing a tax return - 42%
- Completing a homework assignment - 39%
- Reading books/magazines - 38%
- Dictation/transcription - 22%
Survey methodology:
This random double-opt-in survey of 2,000 general population Americans was commissioned by Cricket Wireless between Jan. 20 and Jan. 23, 2023. It was conducted by market research company OnePoll, whose team members are members of the Market Research Society and have corporate membership to the American Association for Public Opinion Research (AAPOR) and the European Society for Opinion and Marketing Research (ESOMAR).
Stories and infographics by ‘Talker Research’ are available to download & ready to use. Stories and videos by ‘Talker News’ are managed by SWNS. To license content for editorial or commercial use and to see the full scope of SWNS content, please email [email protected] or submit an inquiry via our contact form.


Blood test can detect signs of knee condition 8 years before X-rays
Early detection could lead to treatments that slow the progression of the most common form of arthritis.


Man captures ultra rare albino squirrel on camera
The white squirrel has red eyes so is thought to be an albino squirrel.


Adorable dog kicks his leg while he walks
A video captured the pup bouncing along the street of his native China.


Woman with rare ‘Sleeping Beauty’ condition sleeps every four hours
She was diagnosed at age 18 after years of struggling to stay awake in school and nodding off during class.


97-year-old veteran receives WWII service medal 80 years later
"We’re all so proud of Eve."
- Animals2 days ago
Adorable dog kicks his leg while he walks

 Health6 days ago
New study reveals ‘old age’ begins later than it used to

 Wildlife5 days ago
Clever elephant returns visitor’s shoe that fell into enclosure

 Good News6 days ago
Disabled student takes first steps in 10 years on graduation stage

 Entertainment3 days ago
What is the perfect movie length?
- Animals2 days ago
Man captures ultra rare albino squirrel on camera

 Broadcast2 days ago
Are allergies interfering with your social life?

 Travel6 days ago
One-fifth of Americans think about their next vacation while still on vacation